Standard | GPS | pH | Broad Spectrum Extra
Sampling
Soil analysis data is only as good as the sample taken. A sample normally comprises around 1kg of soil which is taken to represent an entire area or field., which contains around 2,000 tonnes of soil per hectare to a plough depth of 20cm (8 inches). It is therefore imperative to otain as representative a sample as possible or the results will not reflect the nutrient status accurately.
We at JSE-Systems take at least 25 cores from each area to be sampled, or where GPS soil sampling and mapping is to be carred out an average of 16 soil cores are taken form each hectare square. The cores are then put together to form a single representative sample. Theses are then thoroughly mixed together and a sub-sample is taken from this and dispatched to the laboratory.
Normal depth is 15cm for arable crops (upto 30cm in min till) and 7.5cm for grassland.
The effects of different cultivations systems on sample techniques
Regular ploughing/cultivations: Nutrients are mixed into a fairly homogeneous soil layer 20-25cm deep (depending on ploughing depth). Nutrient concentrations in a core taken to 15cm should be the same as those in the whole mixed layer.
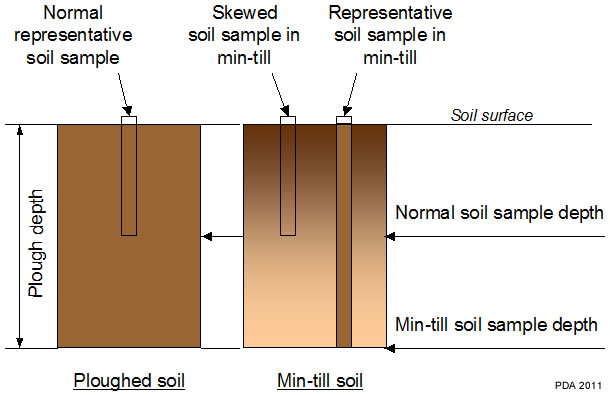
Regular minimum cultivations to 5cm: Applied phosphate and potash will tend to accumulate in the shallow mixed layer leading to stratification of nutrient concentration in the top of the soil profile. Nutrient concentrations in a sample to 15cm depth will not be equivalent to those in the traditional mixed layer, whcih is normally to the depth of ploughing. The samplins will not be comparable and will tend to over-estimate the supply of phosphate and potash available to the crop. Sampling depth to be used upto 30cm (where possible).
Occassional ploughing afterseveral years of minimum cultivations: The soil layer that is mixed by minimum cultivation (and relatively rich in nutrients) will be buried by ploughing to a depth that is not accessed during normal soil sampling. Samples taken after ploughing can underestimate the supply of phosphate and potash available to the crop in these systems. Sampling depth to be used upto 15cm (where possible).
Standard and GPS Soil Mapping
Soil Sampling should be carried out at a minimum of every 4 years on combinable arable farms or for more specialist crops; with specific requirements, before each crop is grown.
JSE-Systems are able to carry out all types of soil sampling, from single pH testing; to “Standard Analysis” pH, P,K, Mg; to a Broad Spectrum Analysis Package, as well as GPS pH and/or nutrient mapping.
What is measured
pH, Phosphate, Potash, Magnesium
The “Standard Analysis” (as used in most cases and in GPS sampling) measures soil acidity (pH) and estimates the plant-available concentrations of the major nutrients, phosphorous (P), potassium (K) and magnesium (Mg), in the soil.
The Total P and K content of a soil can be measured exactly but has little relevance to crop yield because only a relatively small proportion of the total P and K in soils is available to the plant (see Nutrient Reserves in Soil diagram oppposite). Soil analysis in the laboratory therefore uses chemical extractants to provide an estimate of the nutrient which would be available under field conditions. The results provide the best practical guide to determining P,K and Mg in the readily plant-available reserve ‘pool’ shown in the diagram. The methods of soil analysis used in the UK have been developed over many years and have been correlated to crop response, and therefore to fertiliser recommendations, on a wide range odf soils in numerous field experiments. Other measurements on nutrient content or ratios may be made on soils, but unless there is dependable correlation with yield, they are of limited practical value.
Available sodium (Na) can also be measured for potentially responsive crops such as sugar beet.
pH Soil Sampling
pH soil sampling is conducted by taking soil samples methodically across the field ever 1-2 acres and conducting on the spot samples, This is done by placing a few grams of soil in a test tube and mixing it with barium sulphate,de-ionised water and indicator and shaken. The barium sulphate ensures flocculation and precipitation of colloidal clay. The resulting coloured solution is compared with a colour chart to give the correct pH reading Test results are plotted on a field map so that any lime required can be applied in the right place and at the correct rate. Soil indicator solution is the only reliable method of measuring the soil pH however poor and patchy crops and the presence of some acid preferring weed species can be used as a rough indicator.
For further information on the interpretation of soil pH values and influence on nutrient availability click here.
Broad Spectrum Analysis
As part of the our balanced approach to fertiliser advice, we offer a ‘Full Broad Spectrum’ soil analsyis at competitive prices (on a season basis). These anaylsis included the elecro-conductivity and organic matter content (on request). Click here for a PDF sample of our FBS Analysis.
Heavy Metals
In the UK there are statutory soil limits for 7 potential toxic elements (PTE’s) to ensure compliance with EU legislation when sewage sludge (biosolids) is to be applied. These are the ‘heavy metals’ cadmium (Cd), chromium (Cr), copper (Cu), lead (Pb), mercury (Hg), nickel (Ni), and zinc (Zn). The total (acid extractable) content of each of these in soil is measured. The regulations also link the level of these elements tp pH which affects their availability to plants. The limits for PTE’s are defined in the Sludge (Use in Agriculture) Regulations 1989 and are given in the Code of Practice for the Agricultural Use of Sewage Sludge. The Code shows soil limits for additional elements: molybdenum (Mo), selenium (Se), arsenic (As) and fluorine (F).
These same limits apply to the use of PAS100 compost, other PAS products and waste streams applied to agricultural land.
Variations in analysis between laboratories
There are several reasons why different results may be obtained for apparently identical samples analysed by different laboratories. The most obvious reason is the different extractants may have been used. Variations in results can also occur if identical protocols are not followed – techniques of soil drying, grinding and sieving, reagent and equipment temperature, extractant concentrations, extraction shaking, stirring and filtration, extraction time can all affect the result. Results are usually reported in mg/l but were laboratory measures soil by weight instead of volume, the units will be in mg/kg. This can give rise to differences on same soils – particularly those with high levels of organic matter.
The professional Agricultural Analysis Group (PAAG) was established in the UK in 2009 to operate a ring test of participating laboratories to ensure commonality among those in the Group, who all use the offical English, Welsh and Northern Irish methods for soil analysis identified in the Fertiliser Manual (RB209). The also publishes an annual Report on the overall status of the soils which have been analysed by members. Click here
Soil P, K & Mg concentration (mg/I) and Defra Index Scale
Note that the Index is split in half for potassium only and described as 2- (or lower Index 2) and 2+ (or upper Index 2). In the past, Index 2 was not divided in half for potassium but some soil reports used positive and negative signs to denote the extreme top and bottom 10% of each band.
Besides providing a basis to decide fertiliser quantities, soil analysis should be used to monitor the changes in fertility especially where there are uncertainties in the amounts of nutrient removed (e.g. with forage crops) and in the amounts of nutrients applied (e.g. with manures and slurries). For this purpose it is desirable to use the mg/l values not the index. However, differences of less than 5mg/l Oslen P, 25mg/l K and 10mg/l Mg should be ignored unless part of a sustained trend. Where accurate nutrient balance information is used in conjunction with regular soil analysis, it is important to recognise the possibilities of variation as outlined in the above table.